layout: true <!-- <div class="my-footer"><span>arm.rbind.io/slides/xaringan</span></div> --> <!-- this adds the link footer to all slides, depends on my-footer class in css--> --- name: xaringan-title class: left, middle background-image: url(img/background.jpg) background-size: cover # Meet Tidyverse <img src="https://tidyverse.tidyverse.org/articles/tidyverse-logo.png" alt="tidyverse" width="180" /> ### .fancy[Introduction to data visualization with ggplot] .large[Winson Yang | Texas Tech University | 2020-06-18] <!-- this ends up being the title slide since seal = FALSE--> --- class: right, middle <img class="rounded-circle" src="https://github.com/winsonfzyang.png" width="150px"/> # Find me at... [<svg style="height:0.8em;top:.04em;position:relative;" viewBox="0 0 512 512"><path d="M459.37 151.716c.325 4.548.325 9.097.325 13.645 0 138.72-105.583 298.558-298.558 298.558-59.452 0-114.68-17.219-161.137-47.106 8.447.974 16.568 1.299 25.34 1.299 49.055 0 94.213-16.568 130.274-44.832-46.132-.975-84.792-31.188-98.112-72.772 6.498.974 12.995 1.624 19.818 1.624 9.421 0 18.843-1.3 27.614-3.573-48.081-9.747-84.143-51.98-84.143-102.985v-1.299c13.969 7.797 30.214 12.67 47.431 13.319-28.264-18.843-46.781-51.005-46.781-87.391 0-19.492 5.197-37.36 14.294-52.954 51.655 63.675 129.3 105.258 216.365 109.807-1.624-7.797-2.599-15.918-2.599-24.04 0-57.828 46.782-104.934 104.934-104.934 30.213 0 57.502 12.67 76.67 33.137 23.715-4.548 46.456-13.32 66.599-25.34-7.798 24.366-24.366 44.833-46.132 57.827 21.117-2.273 41.584-8.122 60.426-16.243-14.292 20.791-32.161 39.308-52.628 54.253z"/></svg> @winsonfzyang](http://twitter.com/winsonfzyang) [<svg style="height:0.8em;top:.04em;position:relative;" viewBox="0 0 496 512"><path d="M165.9 397.4c0 2-2.3 3.6-5.2 3.6-3.3.3-5.6-1.3-5.6-3.6 0-2 2.3-3.6 5.2-3.6 3-.3 5.6 1.3 5.6 3.6zm-31.1-4.5c-.7 2 1.3 4.3 4.3 4.9 2.6 1 5.6 0 6.2-2s-1.3-4.3-4.3-5.2c-2.6-.7-5.5.3-6.2 2.3zm44.2-1.7c-2.9.7-4.9 2.6-4.6 4.9.3 2 2.9 3.3 5.9 2.6 2.9-.7 4.9-2.6 4.6-4.6-.3-1.9-3-3.2-5.9-2.9zM244.8 8C106.1 8 0 113.3 0 252c0 110.9 69.8 205.8 169.5 239.2 12.8 2.3 17.3-5.6 17.3-12.1 0-6.2-.3-40.4-.3-61.4 0 0-70 15-84.7-29.8 0 0-11.4-29.1-27.8-36.6 0 0-22.9-15.7 1.6-15.4 0 0 24.9 2 38.6 25.8 21.9 38.6 58.6 27.5 72.9 20.9 2.3-16 8.8-27.1 16-33.7-55.9-6.2-112.3-14.3-112.3-110.5 0-27.5 7.6-41.3 23.6-58.9-2.6-6.5-11.1-33.3 2.6-67.9 20.9-6.5 69 27 69 27 20-5.6 41.5-8.5 62.8-8.5s42.8 2.9 62.8 8.5c0 0 48.1-33.6 69-27 13.7 34.7 5.2 61.4 2.6 67.9 16 17.7 25.8 31.5 25.8 58.9 0 96.5-58.9 104.2-114.8 110.5 9.2 7.9 17 22.9 17 46.4 0 33.7-.3 75.4-.3 83.6 0 6.5 4.6 14.4 17.3 12.1C428.2 457.8 496 362.9 496 252 496 113.3 383.5 8 244.8 8zM97.2 352.9c-1.3 1-1 3.3.7 5.2 1.6 1.6 3.9 2.3 5.2 1 1.3-1 1-3.3-.7-5.2-1.6-1.6-3.9-2.3-5.2-1zm-10.8-8.1c-.7 1.3.3 2.9 2.3 3.9 1.6 1 3.6.7 4.3-.7.7-1.3-.3-2.9-2.3-3.9-2-.6-3.6-.3-4.3.7zm32.4 35.6c-1.6 1.3-1 4.3 1.3 6.2 2.3 2.3 5.2 2.6 6.5 1 1.3-1.3.7-4.3-1.3-6.2-2.2-2.3-5.2-2.6-6.5-1zm-11.4-14.7c-1.6 1-1.6 3.6 0 5.9 1.6 2.3 4.3 3.3 5.6 2.3 1.6-1.3 1.6-3.9 0-6.2-1.4-2.3-4-3.3-5.6-2z"/></svg> @winsonfzyang](http://github.com/winsonfzyang) [<svg style="height:0.8em;top:.04em;position:relative;" viewBox="0 0 512 512"><path d="M326.612 185.391c59.747 59.809 58.927 155.698.36 214.59-.11.12-.24.25-.36.37l-67.2 67.2c-59.27 59.27-155.699 59.262-214.96 0-59.27-59.26-59.27-155.7 0-214.96l37.106-37.106c9.84-9.84 26.786-3.3 27.294 10.606.648 17.722 3.826 35.527 9.69 52.721 1.986 5.822.567 12.262-3.783 16.612l-13.087 13.087c-28.026 28.026-28.905 73.66-1.155 101.96 28.024 28.579 74.086 28.749 102.325.51l67.2-67.19c28.191-28.191 28.073-73.757 0-101.83-3.701-3.694-7.429-6.564-10.341-8.569a16.037 16.037 0 0 1-6.947-12.606c-.396-10.567 3.348-21.456 11.698-29.806l21.054-21.055c5.521-5.521 14.182-6.199 20.584-1.731a152.482 152.482 0 0 1 20.522 17.197zM467.547 44.449c-59.261-59.262-155.69-59.27-214.96 0l-67.2 67.2c-.12.12-.25.25-.36.37-58.566 58.892-59.387 154.781.36 214.59a152.454 152.454 0 0 0 20.521 17.196c6.402 4.468 15.064 3.789 20.584-1.731l21.054-21.055c8.35-8.35 12.094-19.239 11.698-29.806a16.037 16.037 0 0 0-6.947-12.606c-2.912-2.005-6.64-4.875-10.341-8.569-28.073-28.073-28.191-73.639 0-101.83l67.2-67.19c28.239-28.239 74.3-28.069 102.325.51 27.75 28.3 26.872 73.934-1.155 101.96l-13.087 13.087c-4.35 4.35-5.769 10.79-3.783 16.612 5.864 17.194 9.042 34.999 9.69 52.721.509 13.906 17.454 20.446 27.294 10.606l37.106-37.106c59.271-59.259 59.271-155.699.001-214.959z"/></svg> winsonfzyang.github.io](https://winsonfzyang.rbind.io) [<svg style="height:0.8em;top:.04em;position:relative;" viewBox="0 0 512 512"><path d="M476 3.2L12.5 270.6c-18.1 10.4-15.8 35.6 2.2 43.2L121 358.4l287.3-253.2c5.5-4.9 13.3 2.6 8.6 8.3L176 407v80.5c0 23.6 28.5 32.9 42.5 15.8L282 426l124.6 52.2c14.2 6 30.4-2.9 33-18.2l72-432C515 7.8 493.3-6.8 476 3.2z"/></svg> winson.yang@ttu.edu](mailto:winson.yang@ttu.edu) --- class: inverse, middle, center # Day II: Data visualization with ggplot2 --- background-image: url(img/ggplot2_masterpiece.png) background-position: 50% 50% background-size: cover class: center, bottom, inverse --- # What is ggplot GG: A Grammar of Graphics! ggplot is a powerful graphics language for creating elegant and complex plots --- # Why ggplot * Automatic legends, colors, etc. * Easy superposition, facetting, etc. * Nice rendering (yet, I don't like the default grey theme). * Store any ggplot2 object for modification or future recall. Super useful for packages. * Lots of users (less bugs, much help on Stack Overflow). * Lots of extensions. * Nice saving option. --- # Grammar of ggplot <center> <img src="img/ggplot_grammar.jpg" width="500"> </center> --- # Setting the canvas: `ggplot()` .pull-left[ ```r df %>% ggplot() ``` ] .pull-right[ <!-- --> ] --- # Setting the aesthetics: `aes()` .pull-left[ ```r df %>% ggplot(aes(x = `GDP per capita`, y = `Healthy life expectancy`)) ``` ] .pull-right[ <!-- --> ] --- # Adding geometric shapes: `geom_*()` .pull-left[ ```r df %>% ggplot(aes(x = `GDP per capita`, y = `Healthy life expectancy`)) + # Adding points to plot geom_point() ``` ] .pull-right[ 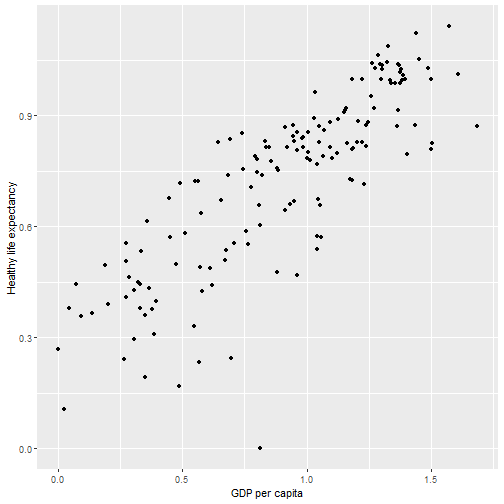<!-- --> ] --- # Stacking geometric shapes: `geom_*()` .pull-left[ ```r df %>% ggplot(aes(x = `GDP per capita`, y = `Healthy life expectancy`)) + # Adding points to plot geom_point() + # Adding line to plot geom_smooth(method = "lm") ``` ] .pull-right[ <img src="Day2_Data-visualization_files/figure-html/plot-geom2-out-1.png" width="90%" /> ] --- # Splitting the graph: `facet_*()` .pull-left[ ```r df %>% ggplot(aes(x = `GDP per capita`, y = `Healthy life expectancy`)) + # Adding points to plot geom_point() + # Adding line to plot geom_smooth(method = "lm") + # Splitting plot into Continents facet_wrap(. ~ Continent, nrow = 2, ncol = 3) ``` ] .pull-right[ 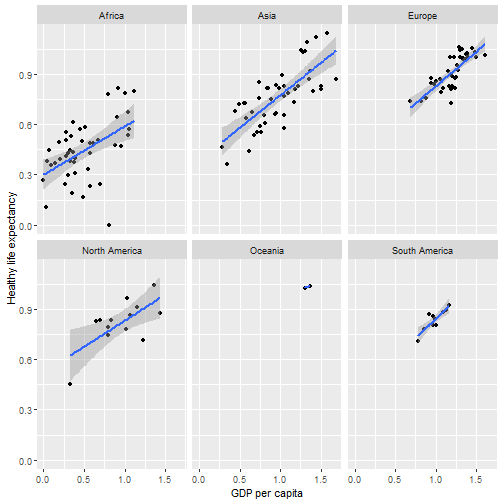<!-- --> ] --- # Adding more details and colors to the plot .pull-left[ ```r df %>% ggplot(aes(x = `GDP per capita`, y = `Healthy life expectancy`)) + # Adding points to plot geom_point(aes(color = Continent), size = 2) + # Adding line to plot geom_smooth(aes(color = Continent, fill = Continent), method = "lm") + # Splitting plot into Continents facet_wrap(. ~ Continent, nrow = 2, ncol = 3) ``` ] .pull-right[ 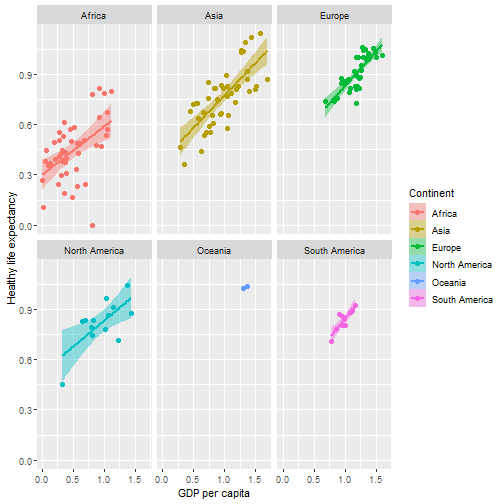<!-- --> ] --- # Beautifying the graph: `theme()` .pull-left[ ```r # Add own color palette mycolors <- c("#003F72", "#C4262E", "#3F9C35", "#E37222", "#970254", "#E59FDB") df %>% ggplot(aes(x = `GDP per capita`, y = `Healthy life expectancy`)) + # Adding points to plot geom_point(aes(color = Continent), size = 2) + # Adding line to plot geom_smooth(aes(color = Continent, fill = Continent), method = "lm") + # Splitting plot into Continents facet_wrap(. ~ Continent, nrow = 2, ncol = 3) + # Adding Manual Colors scale_fill_manual(values = mycolors) + scale_color_manual(values = mycolors) + # Set themes theme_bw() ``` ] .pull-right[ 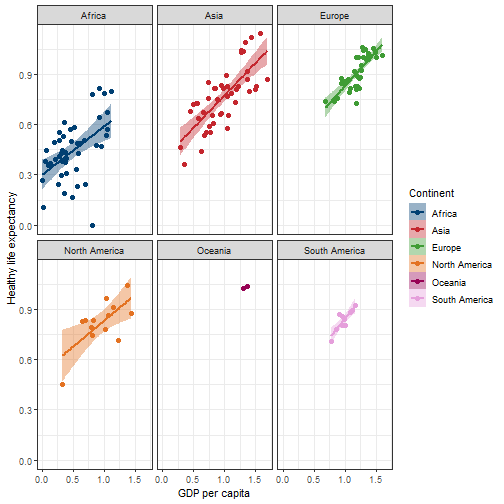<!-- --> ] --- # Adding in-line text: `geom_text()` .pull-left[ ```r # Add correlation cor <- df %>% select(Continent, `GDP per capita`, `Healthy life expectancy`) %>% group_by(Continent) %>% summarize(correlation = round(cor(`GDP per capita`, `Healthy life expectancy`), 2)) df %>% ggplot(aes(x = `GDP per capita`, y = `Healthy life expectancy`)) + # Adding points to plot geom_point(aes(color = Continent), size = 2) + # Adding line to plot geom_smooth(aes(color = Continent, fill = Continent), method = "lm") + # Splitting plot into Continents facet_wrap(. ~ Continent, nrow = 2, ncol = 3) + # Adding Manual Colors scale_fill_manual(values = mycolors) + scale_color_manual(values = mycolors) + # Set themes theme_bw() + # Adding correlation text to plot geom_text(data = cor, aes(x = 1.3, y = 0.05, label = paste("r = ", correlation, sep = "")), size = 5) ``` ] .pull-right[ <!-- --> ] --- class: center, middle # Thanks! # Now let's get hands-on! Slides created via the R package [**xaringan**](https://github.com/yihui/xaringan).